
From childhood through adulting, we often hear phrases like “make healthy choices.” It’s useful advice when you have or can create the healthiest choices for you. And yet, the unfortunate reality is that not everyone has equal access to health — including environmental health and healthcare — though it is possible to make the most of where you are and your circumstances. We want to shine a light on how where you live may impact your choices for a healthy lifestyle.
At BarBend, we put together a study to rank the best and worst states for making healthy choices in terms of nutrition and fitness. We did not call it “the healthiest states” because we recognize that not every state has an equal foundation for health. Instead, we evaluated the states by their structural factors (access to healthcare and environmental health) and then the actionable health choices that residents make. That way, we consider cause and effect rather than the sole outcome of “healthy.”
Here, I’ll break down the data from the study into key findings, provide a rundown of our top and bottom five states, and give some insight into our methodology.
Key Findings
- Three out of the top five states are in the Northeast (New Hampshire, Vermont, and Massachusetts).
- Four out of the five worst states are in the South (Mississippi, Texas, Louisiana, and West Virginia).
- Aside from the specific physical activity and nutrition behaviors that residents exhibit, the biggest institutional factors that make health possible are health and healthcare access and environmental health. However, especially in states with the lowest health and healthcare access and environmental health, agency factors like searching for nutritional information online tended to be very high.
- The Northeast dominates in Healthcare and Health Access scores, which represent access and availability of health services and public health funding.
- Despite overall disappointing rankings, the Midwest does surprisingly well in the Baseline Health score bucket, which represents self-reported physical and mental health status. South Dakota, North Dakota, Minnesota, and Nebraska ranking 1st, 2nd, 4th, and 5th in that scoring section, respectively.
- While Western states weren’t among the top-ranked overall, they generally did well in terms of scores with the Healthy Environment and Healthy Nutrition Behaviors buckets
- Surprisingly, though the Mountain Plains state rankings were spread across the board, Colorado and Utah both scored among the top three states in the Healthy Activity Behaviors bucket.
This interactive map displays each U.S. state’s final ranking based on the results of the data study, allowing users to explore how states compare in building a healthy lifestyle. tap (mobile) or hover (desktop) on any state to view its individual ranking.
Best and Worst States for Building a Healthy Lifestyle
Before we get into the nitty-gritty of it all, what constitutes the best and worst states for building a healthy lifestyle?
According to a health report by the Bipartisan Society, the following percentages determine health: 10% access to care, 20% genetics, 20% environment, and 50% healthy behaviors. This division is good news because it implies that folks who lack access to care and environmental health can still take action for their health with enough knowledge of what to do (and support for how to do it). (2)
The best states in our study were the ones that exhibited high scores in both these areas. Not only do they display healthy behaviors like choosing physical activity and nutritious foods, but the data shows high scores in structural categories like health and healthcare access and a healthy environment. Together, both types of scores tell us which states are best for building a healthy lifestyle.
Access to healthcare and environmental factors may prevent folks in the bottom-ranked states from making as healthy choices as those in the top-ranked states. However, folks in the top-ranked states with the best access and environment may still score lower due to other factors unrelated to their state. These may also be structural — like income level, disability status, family responsibilities, or experiences of systemic oppression like racism.
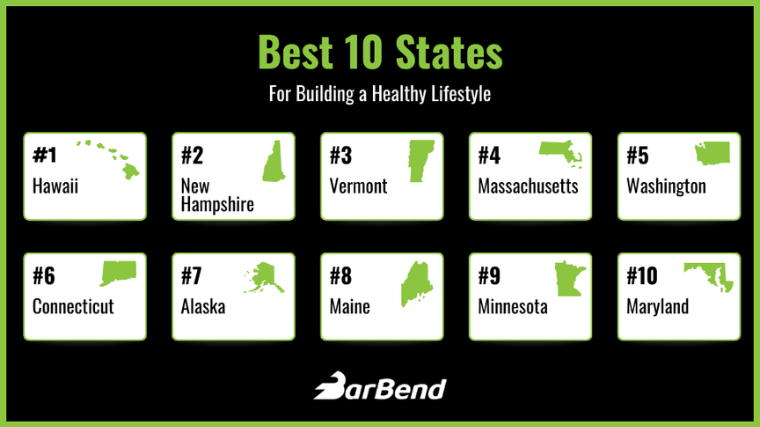
Best States for Building a Healthy Lifestyle
Let’s break down our top five states for making healthy choices. First, I’ll give you the high-level trends across all the data. Then, I’ll briefly explain what went into the scoring of each state. We considered structural factors (baseline health status, healthcare access and environmental health) and agency factors (nutrition and fitness behaviors) for each state. At the bottom of this section, you can see the top 10 states with their overall scores.
Note that you’ll hear us refer to state scores here throughout this discussion. “Score” means how many points we awarded the state for the corresponding data point in that category. More points are given the higher your data point falls within the state-by-state range, fewer are given for the closer to the bottom of the range you fall.
Trends:
- Three of the five best states are in the Northeast; the remaining two are in the West — specifically, the Pacific Northwest. One of the worst states is also in the West, but it is the Southwest. Northern states may have better environmental health than Southern states.
- All top five states have nearly perfect or perfect scores in the healthy environment category (for air quality, land pollution, and water pollution).
- According to a 2021 report, two of the top five states with the highest historical investment in public health, Hawaii and Massachusetts, also ended up in our top five. (1)
- Massachusetts is the best state for the number of people with health insurance, and Vermont is the best state for access to mental healthcare.
- Massachusetts is the best state for the cost of food related to median income.
- Hawaii is the best state for people who have seen a dentist in the last year and has the lowest consumption of sugar-sweetened beverages.
- Hawaii is the best state for the air quality index.
The Top 5 States:
1. Hawaii
Hawaii received a top score in the air quality index and nearly perfect scores in land and water pollution. In the healthcare access department, the state received a 0.99 (out of 1) in the “has health insurance” category and a top 1.00 in “has seen a dentist in the last year.” They were a little lower in seeing a doctor in the last year and much lower in having sufficient access to mental healthcare. They got an average score on people having access to enough food and an average in the food desert department.
It’s important to note, however, that this does not mean that people who live in Hawaii don’t experience structural barriers to health and health care. A 2017 study published in the Hawai’i Journal of Medicine and Public Health notes that Native Hawaiians and Other Pacific Islanders (NHOPI) experience disproportionate health risks and disproportionately low access to health care. (3) Like the health disparities found across the country, the health disparities experienced by NHOPI are legacies of long histories of oppression, structural marginalization, and violence.
Yet, much of the data collected demonstrates high levels of self-reported health. The self-reported health section saw a high 0.98 out of 1 score for people who rate their health as “good” or better, and a 0.78 (relatively high) for people who report zero or a few bad mental health days.
Nutrition behaviors were all extremely high — the people of Hawaii earned a top score in the category of consuming the least amount of sugar-sweetened beverages. They also scored high on low spending in restaurants and high on Google searches on healthy nutrition topics.
Fitness behaviors scored lower than nutrition behaviors. While they got an average score on people who reported having done physical activity in the last 30 days, people living in Hawaii got a low score on the percentage of active youth — only 17.4% of children aged 6 to 17 get 60 minutes or more of exercise per day. They had a middle score on Google searches on local exercise terms and beginner workout terms.
Hawaii is an interesting example; it landed the number one spot on our list due to its excellent health access, environment, and nutrition choices, but the exercise choices were slightly lower. This may reflect the particular framing of physical activity questions.
2. New Hampshire
Moving to the Northeast, New Hampshire is up next. In another stellar environment, the state received our top score in land and water pollution. The air quality index, however, got a middle score (0.53). Of course, across the country, environmental racism persists: communities of color are consistently exposed to higher levels of air toxins than their white peers. (4) So, while these neighborhood-by-neighborhood statistics may even out state-by-state, it’s critical to keep in mind that the entire state may not represent each community.
Yet across the health access category, New Hampshire shines with food. The state got a close to perfect score on the food cost related to the median income. The average adult spends 9.9% of their income on food, which is very low compared to other states. They also scored close to 1.0 on people reporting that they have enough food; only 6.1% of the state is considered a food desert.
The state also rates high with having health insurance and access to mental healthcare. It got a high score (0.91) for people rating their health as “good” or better, and a mid-range score (.67) for people reporting zero to few bad mental health days.
Nutrition behaviors were average regarding restaurant spending, sugary beverage consumption, and searching for nutrition information online. They scored better in the fitness behavior category —- a higher amount reported exercising in the last 30 days, and 24% of children aged 6 to 17 get 60 minutes or more of exercise per day. Their highest fitness scores were for interest in local exercise opportunities and information on workouts for beginners.
3. Vermont
Moving along our list, Vermont is up next, with a perfect score in land pollution and close to perfect in water pollution; the air quality index is lower.
Vermont earned itself a top score in the category of sufficient access to mental healthcare. Although the score for people with health insurance is relatively high at 0.87, the score for people who have seen a doctor in the last year was below average at 0.47, though the seeing a dentist score was a bit higher at 0.67. They got a high score of 0.98 for people rating their health as “good” or better, but closer to average (0.57) on self-rating of bad mental health days.
Vermont got a 1.00 in restaurant spending, meaning people spend much less eating out and more on eating in. The state got average scores on other nutrition behaviors, including consumption of sugary beverages and interest in searching for nutrition terms.
In the fitness behavior department, things split up. The state got an excellent 0.80 for people who reported exercising within the last 30 days and an average score (0.57) for active youth. They scored low on Internet searches for local exercise information and beginner workout programs.
4. Massachusetts
Although Massachusetts is fourth on the list, it received the most top scores overall across several categories. The state received a top score for people with health insurance and the relation of food cost to median income (adults only spend 9.3% of their income on food). Massachusetts also got a top score in people rating their health as “good” or better.
The state has several other very high (just not top) scores in the following categories: for seeing a dentist in the last year, access to mental healthcare, and land and water pollution. The air quality index is much lower, which seems to be a common trend even when the land and water are in excellent shape.
It gets interesting here: Massachusetts has excellent healthcare access and environmental factors. Still, the state lost points and ended up at number four on our list because residents’ fitness and nutrition scores were much lower. While structural factors can give you a huge leg up, personal choices remain, and there was a disparity here.
People across the state scored low (0.33) in searching for nutrition information online but average in sugary beverage consumption and high in not spending much on restaurants (so, folks might be eating out a lot). Their lowest score (0.35) was in fitness behaviors for only 19.4% of children aged 6 to 17 who exercise 60 minutes per day — the state’s residents scored high in searching for local exercise opportunities and low in searching for beginner workouts.
5. Washington
Moving back west, Washington is number five. It is another beautiful state with a lot of access to nature. The state got a perfect 1.00 for land pollution and 0.97 for water pollution. Although the air quality index was lower at 0.71, it still scored higher than some Northeast states.
Washington’s highest score in health access was for food cost related to median income — the average adult spends 9.9% of their income on food. Though its score of 0.74 indicates a high rate of citizens with health insurance (which may not include disproportionately low access to health care experienced by undocumented immigrant communities), Washington rated just 0.15 in terms of those who have seen a doctor in the last year, with some of the lowest rates in the nation. (5) It scored better in terms of dentist visit rate (0.71), and even higher for mental healthcare access (.076).
Washington also scored low for people who report having only a few bad mental health days (0.37) but high for reporting their general health is good (0.83).
Reported nutrition behaviors were pretty solid — a high score for low restaurant spending and 0.99 for low consumption of sugar-sweetened beverages. They were also solid in physical activity — residents scored a high 0.96 in people who reported exercising in the last 30 days, though very average (0.55) in active youth — 22.6% of children get at least 60 minutes per day of exercise. Their interest in search terms on local fitness and beginner workouts was also average or below.
Top 10 Ranking States |
||||||
|
Rank |
State |
Healthcare and Health Access Score |
Baseline Health Status Score |
Healthy Environment Score |
Healthy Nutrition Behavior Score |
Healthy Activity Behavior Score |
|
1 |
Hawaii |
63.4 |
88.2 |
99.6 |
90.0 |
50.1 |
|
2 |
New Hampshire |
70.2 |
78.6 |
84.2 |
63.1 |
74.2 |
|
3 |
Vermont |
75.5 |
76.3 |
85.2 |
73.5 |
59.9 |
|
4 |
Massachusetts |
83.8 |
77.6 |
82.2 |
60.3 |
64.0 |
|
5 |
Washington |
62.9 |
60.1 |
89.1 |
78.5 |
61.1 |
|
6 |
Connecticut |
69.7 |
81.6 |
79.6 |
60.0 |
59.4 |
|
7 |
Alaska |
49.7 |
72.3 |
80.2 |
76.2 |
57.3 |
|
8 |
Maine |
71.3 |
71.5 |
84.9 |
63.1 |
54.4 |
|
9 |
Minnesota |
65.1 |
83.7 |
83.0 |
50.4 |
59.6 |
|
10 |
Maryland |
61.9 |
74.9 |
78.3 |
66.3 |
55.7 |
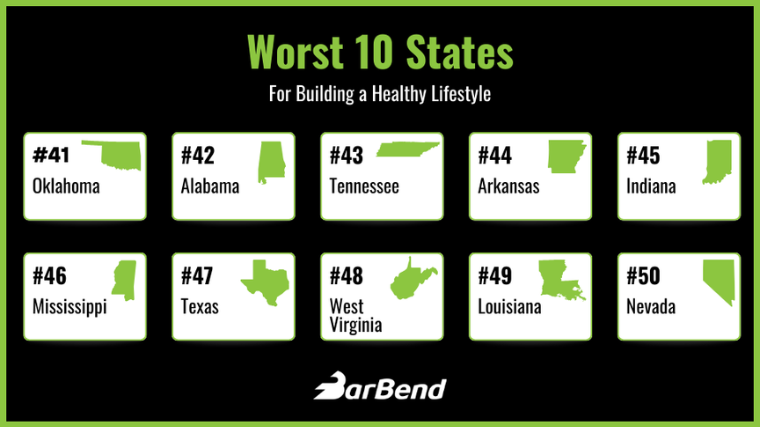
Worst States for Building a Healthy Lifestyle
Now for the flip side. Let’s dig into the worst states for making healthy choices. First, I’ll explain the high-level trends in this group and then get into what went into the scoring of each state and how they landed at the bottom. At the end of this section, you will see the bottom 10 states and their overall scores.
Trends:
- The bottom five states received low scores from structural categories like health and healthcare access and environmental health. However, a few of their scores in agency categories, such as nutrition and physical activity behaviors, came close to some of the best states.
- Four of the bottom five states are in the South, and the fifth is in the West. While the two best states are in the West, the worst state is in the Southwest, so environmental differences play a role.
- According to a 2021 report, one of the bottom five states for historical investment in public health, Nevada, also ended up in our bottom five. It’s the worst state overall. (1)
- Texas is the worst state for the number of people with health insurance and access to mental healthcare.
- Mississippi is the worst state for the cost of food related to median income and food deserts (29.8% of the state is in one).
- Mississippi also received the lowest score for people reporting having been physically active in the last 30 days.
- Louisiana is the worst state for land pollution.
The Bottom 5 States:
46. Mississippi
Let’s start with the positive — Mississippi has above-average scores for land pollution (0.75) and water pollution (0.77), and just below (0.48) for air quality.
The state has several very low scores in healthcare and health access, with two being bottom scores. The bottom scores are for food costs related to median income (adults spend 16.1% of their income on food), and for food deserts — 29.8% of the state is a food desert. The state also ranks very low (0.33) in people saying they have enough food.
Although the state was just below average (0.48) for people with health insurance, it scored well for people who have seen a doctor in the last year (0.78). But it scored close to zero in access to mental healthcare and seeing a dentist, as well as very low in public health spending. Residents also self-reported extremely low (0.08) when rating their health as good or bad.
In the behavioral categories, residents don’t seem to spend much on restaurants but score poorly for consuming sugary beverages. Interestingly, they got one of their highest scores (0.95) for searching for healthy nutrition terms — telling us that people in Mississippi seek information on healthy choices, perhaps because there is such little access to structural support in the form of public health spending.
In fitness behaviors, the state got a bottom score (0.00) in people who have exercised in the last 30 days and scored very low in searching for local exercise opportunities or beginner workout information. However, their percentage of active youth got a higher score (0.71) than some higher states.
47. Texas
Texas does OK environmentally. They have a 0.83 for land pollution, a 0.92 for water pollution, and a below-average 0.46 for air quality. Most of its lowest scores (including two bottom scores) are in the health access category.
The two bottom scores are for people with health insurance (0.00) and access to mental healthcare (0.00), indicating the lowest state rates in each category. The state scored low for people having seen a doctor in the last year (0.33) and close to zero for seeing a dentist (0.03). The food desert score was also poor, with 19.6% of their state in one.
Texans gave an average rating of their perceived health (0.46) and lower on bad mental health days (0.35). They are average across the board in nutrition behaviors and a little below average in fitness behaviors. Their lowest score came from a lack of active youth (0.11). There was low interest in beginner workout terms and below-average rates of people who have exercised recently, but they did get a higher score (0.63) in searching for local exercise opportunities.
Again, this score shows that people may still be interested in learning more about healthy behaviors, even if they aren’t currently acting on them and have little access to publicly funded support for healthcare opportunities.
48. West Virginia
Staying in the south, West Virginia is next on the list. Environmentally, the state got high land and water pollution scores but scored just above the average for the air quality index.
In healthcare access, they got a high score (0.80) for people with health insurance and almost equal (0.78) for people who have seen a doctor in the last year. Seeing a dentist was extremely low, however, at 0.04. They also got a low score in access to mental healthcare and having sufficient access to food.
They received two bottom scores for self-reported health — a 0.0 for people rating their health as “good” and 0.0 for reported rates of bad mental health days.
Behaviorally, they got a very low score (0.18) for sugar beverage consumption and very low (0.11) for people having exercised in the last 30 days. They got similar low scores on interest in searching for local fitness opportunities or beginner workouts.
Like Mississippi, despite adults scoring low in fitness, active youths received a high score of 0.86, with 27.5% of children playing getting 60 minutes or more of exercise per day. In states with less access to structural healthcare opportunities and other necessities, children seem to stay active.
49. Louisiana
As we near the end of the list, the scores continue to drop. While Louisiana scored well in water pollution, it got a very low score for land pollution (0.25), and the air quality index was average.
The state’s lowest scores came in the healthcare and health access categories. Although people with health insurance were above average (0.68) and people who saw a doctor in the last year were high (0.81), dentist visits were low (0.21), as was mental healthcare (0.28).
Louisiana also came in with one of the lowest scores for public health spending and a poor relation between food cost and meridian income, with adults spending 14.2% of their income on food. It has low scores for people not having access to food and for 22.3% of the state being a food desert.
Louisiana scored low for people describing their health status as “good” or better (.32) and scored very low for bad mental health days (0.15).
In the nutrition behavior category, the state scored poorly on high consumption of sugary beverages. Still, residents scored high in searching for healthy nutrition terms (0.87) — another area with a large gap between less access to healthy choices and a high interest in learning more.
For fitness behavior, they scored equally low in adults exercising in the last 30 days (.24) and the percentage of youth being active (.23). They also had below-average scores for search terms for local exercise and beginner workouts.
50. Nevada
Returning to the West, the worst state on our list is Nevada. They have a bottom score of 0.00 for land pollution. The air quality index is low at 0.29. This culminates in an overall low score for their environment.
The state also scored consistently low in healthcare access. Nevada got one of the lowest scores for people with health insurance (0.34) and extremely low for people who have seen a doctor in the last year (0.04), with seeing a dentist higher but still low (0.22). Access to mental healthcare got a similarly low score of 0.26.
Nevada has one of the lowest scores for public health spending (0.02) and pretty low for people with enough food (0.34). Residents rated their health more bad than good and had an equally low score for bad mental health days.
In nutrition behaviors, Nevada has a 0.00 score for restaurant spending, meaning they spend the most on eating out, even having adjusted for cost of living. However, residents seem average in sugary beverage consumption and searching out healthy nutrition terms.
Nevada received the bottom score (0.00) for active youth and a relatively low score (0.38) for people who have exercised in the last 30 days. They also had a very low score (0.16) in search terms for beginner workouts. Environmental factors may be at play here, especially with the increasing effects of climate change — it is hard and even dangerous to have children (or adults!) go play outside in an increasingly hot and dry desert. Access to shaded parks and play areas and publicly available, air-conditioned exercise facilities may be helpful.
As some other states had higher environmental scores or active youth, Nevada has low scores across the board, which landed them at the bottom.
Bottom 10 Ranking States |
||||||
|
Rank |
State |
Healthcare and Health Access Score |
Baseline Health Status Score |
Healthy Environment Score |
Healthy Nutrition Behavior Score |
Healthy Activity Behavior Score |
|
41 |
Oklahoma |
37.6 |
32.0 |
72.3 |
74.2 |
35.8 |
|
42 |
Alabama |
33.7 |
29.8 |
70.2 |
67.2 |
44.7 |
|
43 |
Tennessee |
37.8 |
28.9 |
69.3 |
53.5 |
48.1 |
|
44 |
Arkansas |
29.1 |
22.8 |
73.4 |
67.7 |
38.1 |
|
45 |
Indiana |
44.8 |
47.4 |
39.4 |
61.8 |
45.0 |
|
46 |
Mississippi |
25.2 |
32.3 |
66.5 |
70.0 |
31.4 |
|
47 |
Texas |
18.0 |
40.3 |
73.6 |
51.8 |
37.5 |
|
48 |
West Virginia |
47.6 |
0.0 |
74.8 |
60.6 |
36.2 |
|
49 |
Louisiana |
35.8 |
23.3 |
57.6 |
62.4 |
31.5 |
|
50 |
Nevada |
30.7 |
35.2 |
43.0 |
42.9 |
24.8 |
So What? Healthy Choices, Your State, and You
There are structural factors impacting each individual across the country that facilitate — or restrict — our access to health. There are also choices we can make while navigating these (often unjust) factors. Not everyone can or wants to move to a state where healthy lifestyles are more feasible, so each individual can try to make the most of what they can access — and according to our data, people are trying to do just that. There are also more significant changes we can advocate for in our communities, states, and nations, especially in an election year (or every year in the case of ever-important local elections). Here are some action items.
How Individuals Can Make Healthy Personal Choices
- Walking is a free and accessible form of exercise (for those who can walk, and who live in a safe enough environment to do so). If your neighborhood is not conducive to walking, you can consider going to a gym or getting one of the best treadmills for your home. Try adding 30-minute walks a few times a week to work up to reaching the CDC-recommended amount of cardio exercise for heart health (150 to 300 minutes of moderate-intensity exercise, 75 to 150 minutes of high-intensity exercise, or a combination). (1)
- The CDC also recommends two days of muscle-strengthening (or resistance training) exercise. There are many free resources to learn how to get started with bodyweight exercises or lifting weights. Check out BarBend’s beginner’s guide to the gym.
- Healthy eating doesn’t have to be complicated or expensive, nor about the best supplements for weight loss. An overall healthy diet consists of whole foods like lean protein sources (vegan protein as well), fruits, vegetables, grains, and healthy fats. Add some of these instead of trying to cut things out of your diet. You can also check out our guide to how to eat healthy on a budget.
- Having consistent access to healthy food is tough if you live in a food desert. If you can access public transportation or a car, you can make a few monthly trips to a store with healthy options. If you can buy produce in bulk, you can freeze it for later.
How We Can Support Health in Our Communities
- Some city neighborhoods have community refrigerators, where folks with more access to food can purchase and donate healthy options for others in their community.
- Voting or helping others register to vote plays a very significant role in any community’s access to health: whether it’s federal decisions on health insurance access or local decisions on zoning (which deeply impact environmental justice and health access), the polls can be a very important place to show up for your community.
- Advocate for safety features that help make your community walkable and bikeable while still maintaining the character of your neighborhood. This may include reporting unsafe or missing crosswalks, sidewalks, and lighting in your community. You can also report areas where traffic behaviors may cause someone to avoid biking or walking to avoid negligent drivers. Voting or helping others register to vote can also help ensure that social and infrastructure services are actually being allocated to your community.
How We Can Support Health in Our State and Nation
- Many of the bottom-ranking states received low scores on public health spending. States can take the initiative to invest more in health and education. (Again, voting is one way to impact this spending.)
- If you can support any movements for health at the local or national level, you can help make a difference for people in states with poor access to health. You might also consider supporting organizations in your or other states or regions dedicated to promoting structural equity and health for all communities. Just two examples are the Southern Poverty Law Center and the National Black Trans Advocacy Coalition.
Best and Worst States for Making Healthy Choices: Full Data
Here is the complete data for all 50 states, with the best states at the top and the worst at the bottom.
|
All States |
||||||
|
Rank |
State |
Healthcare and Health Access Score |
Baseline Health Status Score |
Healthy Environment Score |
Healthy Nutrition Behavior Score |
Healthy Activity Behavior Score |
|
1 |
Hawaii |
63.4 |
88.2 |
99.6 |
90.0 |
50.1 |
|
2 |
New Hampshire |
70.2 |
78.6 |
84.2 |
63.1 |
74.2 |
|
3 |
Vermont |
75.5 |
76.3 |
85.2 |
73.5 |
59.9 |
|
4 |
Massachusetts |
83.8 |
77.6 |
82.2 |
60.3 |
64.0 |
|
5 |
Washington |
62.9 |
60.1 |
89.1 |
78.5 |
61.1 |
|
6 |
Connecticut |
69.7 |
81.6 |
79.6 |
60.0 |
59.4 |
|
7 |
Alaska |
49.7 |
72.3 |
80.2 |
76.2 |
57.3 |
|
8 |
Maine |
71.3 |
71.5 |
84.9 |
63.1 |
54.4 |
|
9 |
Minnesota |
65.1 |
83.7 |
83.0 |
50.4 |
59.6 |
|
10 |
Maryland |
61.9 |
74.9 |
78.3 |
66.3 |
55.7 |
|
11 |
Idaho |
52.6 |
68.2 |
74.7 |
74.0 |
59.9 |
|
12 |
South Dakota |
61.8 |
94.8 |
79.2 |
53.8 |
46.0 |
|
13 |
North Dakota |
61.9 |
89.7 |
74.9 |
48.1 |
58.7 |
|
14 |
Oregon |
58.5 |
46.2 |
85.5 |
76.2 |
56.0 |
|
15 |
Colorado |
49.5 |
66.6 |
69.7 |
55.2 |
76.1 |
|
16 |
New Jersey |
58.8 |
77.2 |
76.6 |
58.2 |
54.7 |
|
17 |
Utah |
54.4 |
62.1 |
50.9 |
72.0 |
69.9 |
|
18 |
Rhode Island |
80.8 |
70.7 |
84.9 |
55.2 |
41.8 |
|
19 |
Delaware |
58.7 |
76.5 |
64.4 |
64.5 |
49.3 |
|
20 |
Wisconsin |
69.0 |
65.7 |
78.8 |
55.4 |
51.3 |
|
21 |
Virginia |
55.9 |
57.0 |
82.1 |
58.6 |
57.3 |
|
22 |
Pennsylvania |
64.8 |
53.4 |
71.0 |
65.7 |
57.1 |
|
23 |
Montana |
58.3 |
62.6 |
77.0 |
65.1 |
47.2 |
|
24 |
Nebraska |
57.2 |
81.8 |
78.5 |
49.8 |
45.9 |
|
25 |
Michigan |
61.0 |
58.5 |
76.5 |
59.8 |
47.3 |
|
26 |
New York |
66.6 |
59.8 |
82.1 |
52.9 |
46.1 |
|
27 |
Kansas |
45.0 |
71.4 |
76.2 |
50.0 |
52.9 |
|
28 |
South Carolina |
40.7 |
67.0 |
76.9 |
55.5 |
48.3 |
|
29 |
Wyoming |
46.2 |
81.2 |
78.5 |
45.0 |
43.3 |
|
30 |
Iowa |
67.2 |
73.4 |
64.0 |
55.4 |
41.3 |
|
31 |
North Carolina |
42.0 |
56.6 |
75.9 |
60.2 |
50.2 |
|
32 |
California |
51.9 |
47.3 |
64.8 |
75.2 |
47.5 |
|
33 |
Illinois |
58.3 |
60.2 |
73.5 |
41.6 |
57.7 |
|
34 |
Florida |
35.4 |
65.0 |
74.9 |
56.7 |
45.9 |
|
35 |
Georgia |
24.3 |
52.9 |
77.7 |
54.3 |
58.9 |
|
36 |
Missouri |
44.4 |
45.6 |
74.1 |
52.5 |
54.6 |
|
37 |
Ohio |
56.1 |
43.1 |
73.0 |
54.2 |
49.8 |
|
38 |
New Mexico |
40.3 |
45.6 |
76.0 |
65.5 |
38.5 |
|
39 |
Arizona |
34.0 |
47.9 |
64.3 |
66.5 |
46.2 |
|
40 |
Kentucky |
49.1 |
38.3 |
67.8 |
61.6 |
42.9 |
|
41 |
Oklahoma |
37.6 |
32.0 |
72.3 |
74.2 |
35.8 |
|
42 |
Alabama |
33.7 |
29.8 |
70.2 |
67.2 |
44.7 |
|
43 |
Tennessee |
37.8 |
28.9 |
69.3 |
53.5 |
48.1 |
|
44 |
Arkansas |
29.1 |
22.8 |
73.4 |
67.7 |
38.1 |
|
45 |
Indiana |
44.8 |
47.4 |
39.4 |
61.8 |
45.0 |
|
46 |
Mississippi |
25.2 |
32.3 |
66.5 |
70.0 |
31.4 |
|
47 |
Texas |
18.0 |
40.3 |
73.6 |
51.8 |
37.5 |
|
48 |
West Virginia |
47.6 |
0.0 |
74.8 |
60.6 |
36.2 |
|
49 |
Louisiana |
35.8 |
23.3 |
57.6 |
62.4 |
31.5 |
|
50 |
Nevada |
30.7 |
35.2 |
43.0 |
42.9 |
24.8 |
Methodology
We ranked all 50 states by their scores in 5 separate buckets: healthcare and health access score; baseline health status score; healthy environment score; healthy nutrition behavior score; and healthy activity behavior score. Each bucket consists of individual data points and corresponding scores – data points that represent a healthier outcome get a higher score, whereas data points that represent less healthy outcomes get a lower score. Buckets were weighted in alignment with specific drivers of health outcomes to create a final score and subsequent ranking.
These buckets consist of 50% structural factors (access and environment) and 50% agency-exercising behaviors (nutrition and physical activity choices).
We gathered our data from resources including the CDC, EPA, USDA, Census, USA Facts, America’s Health Rankings, Mental Health America, the Current Developments in Nutrition research journal, Restaurant.org, and Google Trends.
Press Inquiries
Are you a journalist or publisher interested in covering this story? Contact Remi@BarBend.com for information requests.
References
- State Public Health Funding. Exploring 2021 State Public Health Funding Estimates Using State Health Compare. https://www.shadac.org/sites/default/files/publications/State%20Public%20Health%20Funding_10.22.pdf
- What Makes Us Healthy vs. What We Spend on Being Healthy. Bipartisan Policy Center. https://bipartisanpolicy.org/report/what-makes-us-healthy-vs-what-we-spend-on-being-healthy/
- Morisako, A. K., Tauali’i, M., Ambrose, A. J. H., & Withy, K. (2017). Beyond the Ability to Pay: The Health Status of Native Hawaiians and Other Pacific Islanders in Relationship to Health Insurance. Hawai’i journal of medicine & public health : a journal of Asia Pacific Medicine & Public Health, 76(3 Suppl 1), 36–41.
- Alvarez C. H. (2023). Structural Racism as an Environmental Justice Issue: A Multilevel Analysis of the State Racism Index and Environmental Health Risk from Air Toxics. Journal of racial and ethnic health disparities, 10(1), 244–258. https://doi.org/10.1007/s40615-021-01215-0
- Alarcon F. J. (2022). The Migrant Crisis and Access to Health Care. Delaware journal of public health, 8(4), 20–25. https://doi.org/10.32481/djph.2022.10.006
Featured Image: Sabrina Bracher / Shutterstock